Welcome to the first edition of the Hockey Graphs newsletter! This newsletter, created and written by a selection of Hockey Graphs contributors, aims to provide short-form, timely content that complements the research on our site. You can read more about our goals for this newsletter here, and feel free to reach out on Twitter and let us know what you’d like us to cover.
In this issue:
Alison Lukan and Shayna Goldman discuss three keys to the Tampa-Boston series in Watch the Game.
Shawn Ferris breaks down the Golden Knights’ defensive zone coverage in The Eye Test.
Meghan Hall explains the “power kill” trend and reveals where you can find data for your own analyses in From the Spreadsheets.
—The Hockey Graphs team
Watch the Game
Alison Lukan and Shayna Goldman
As with any team in the second round, the Boston-Tampa Bay matchup has rosters riddled with talent. Everyone knows about Pastrnak and Bergeron...Kucherov and Hedman. But beyond the five-on-five game, what difference makers exist in this series? Perhaps it’s all about looking for power in unexpected places...
TAMPA’S MAN DIS-ADVANTAGE
With all of the shooting talent highlighting the Lightning’s power play, it should be a slam dunk advantage for them. It wasn’t to end the regular season, and hasn’t been since returning to play.
Tampa’s power play operated at 23.1 percent during the regular season (fifth in the league). But their actual goal scoring rate of 8.11 per 60, which ranked seventh in the league, outpaced their rate of expected goals for (6.88 xGF per 60, 16th in the league), which can be used as a proxy for their shot quality. Outperforming expected goals eventually caught up with them. In the last 25 games of the season, their scoring rate regressed to 4.16 per 60, even though their expected goals didn’t dip by much. Their shooting percentage, however, dropped to a league low of 7.69 percent.
Since returning to play, Tampa Bay’s power play’s clicked at a rate of just 11.1 percent, which is one of the lowest in the league. Shot volume hasn’t been the cause, and there’s even been an improvement in shot quality (7.20 xGF per 60). But a 6.83 shooting percentage helps explain their diminished scoring rate of just 4.16 per 60.
If the Lightning can continue generating at least this level of offense on the power play, watch for it to finally start producing – unless the Bruins’ penalty kill disrupts that.
BOSTON’S POWER KILL
For every item that raises concern over the Lightning’s power play, there’s an equal list of reasons why the Bruins’ penalty kill is such a weapon - and it may be an advantage to maximize in this series.
First, Boston stifles their opponent. They were fourth in the NHL this season in suppressing power play offensive quality (6.03 xGA per 60), and third best in allowing actual goals (5.58 GA per 60).
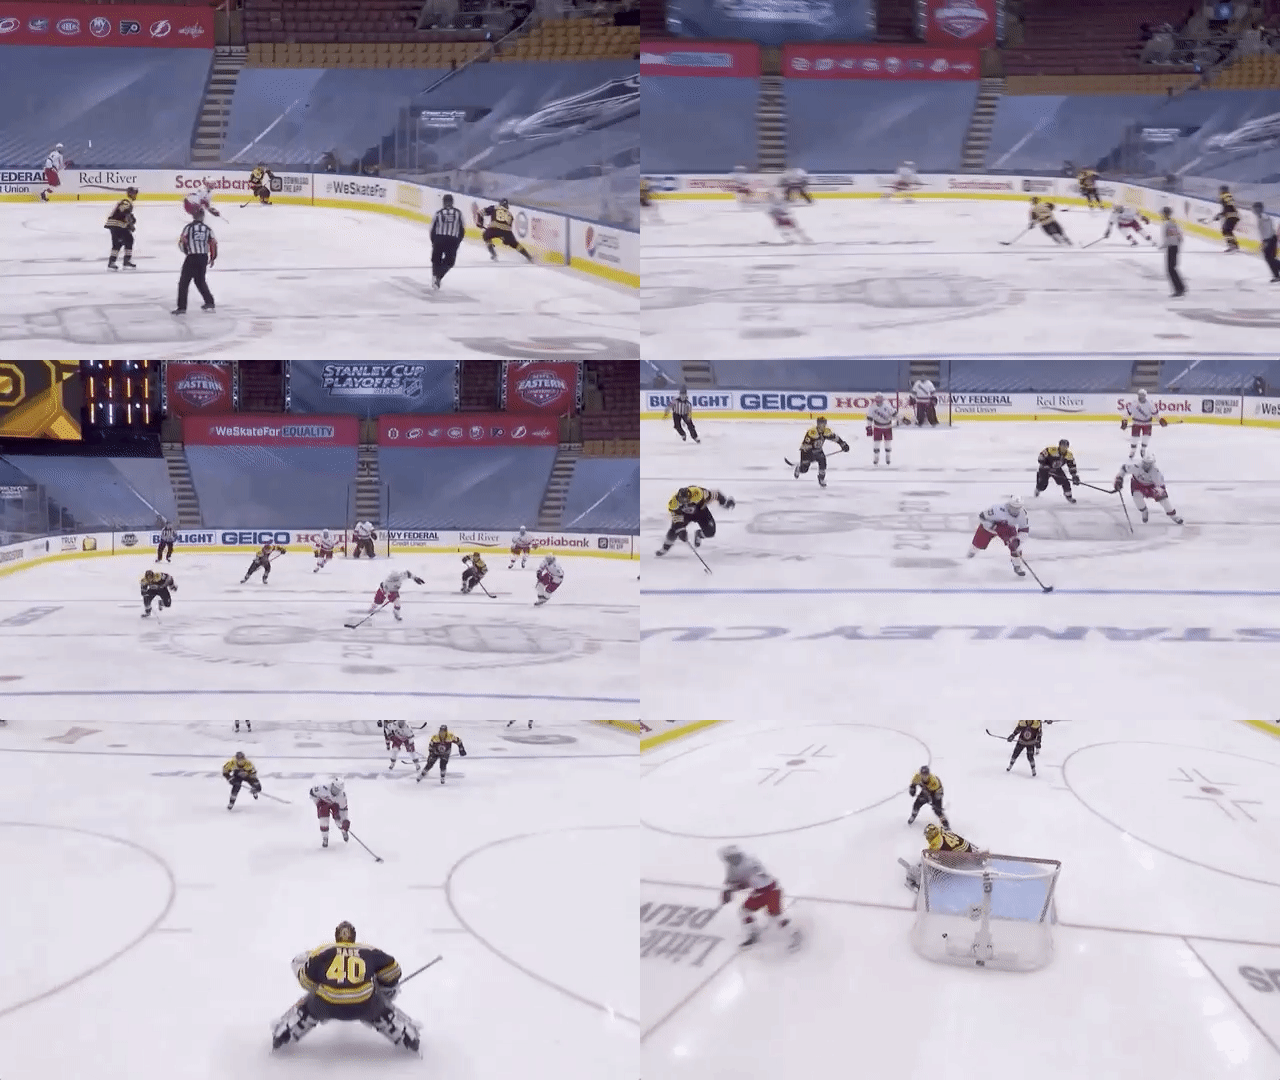
Second, and what makes the Bruins’ so dangerous, is that they’ve evolved their four-man units into a “power kill” one that is an offensive threat in its own right. (And stay tuned in this newsletter for more on the power kill.) They were fourth overall this year in unblocked shot attempts for (16.44 per 60), and they don’t just eat up true possession, they eat up time. Watch for Boston to just hold onto the puck when shorthanded, passing back and forth, running out the clock even before they try to get a shot off. It bears mention that Patrice Bergeron and Brad Marchand rank second and third among Bruins forwards in terms of PK time.
THE SECRET ABOUT A “BACKUP”
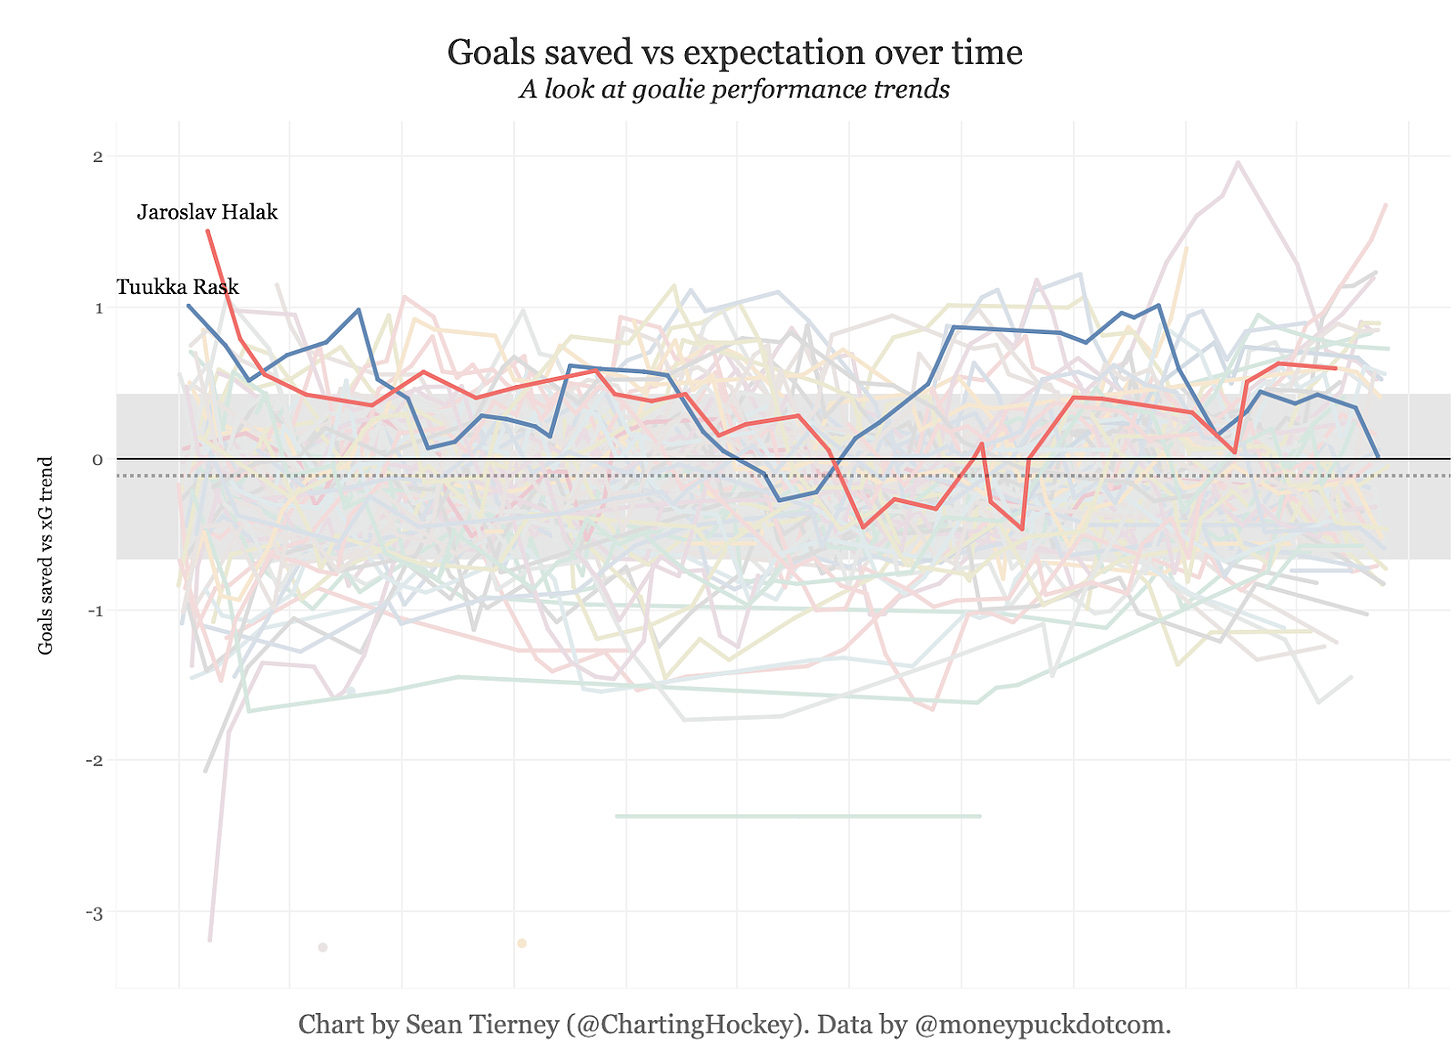
There’s no question Tuukka Rask is a top tier goaltender who deserves every amount of praise he gets, but when the player left the bubble due to personal reasons, there was some concern about the state of play in net. But pay it no mind. For those who didn’t already know, Jaroslav Halak makes up a 1A / 1B tandem with Rask, with the latter playing more by just a 10-game margin. And while Halak did dip a bit in terms of saving more than he should this season, he’s been overall a quality netminder, and has been performing slightly better (-.34 dFSv%) than his fellow goaler (-.77 dFSv%) in an almost equal amount of post-season play.

It will be interesting, however, to watch how both teams in this series manage at least one guaranteed back-to-back with a possible second should things go to a Game 7.
Data via Evolving-Hockey.com, through game 1 of the second round.
The Eye Test
Shawn Ferris
Before the drama at the goaltending position, there was drama at the coaching position. Back in December, it became quite a shock to many of us that the Vegas Golden Knights fired Gerard Gallant for Peter DeBoer. The speculation for the firing was set around the defensive zone coverage.
For the first two seasons, the Golden Knights deployed the simplest type of defensive zone coverage – man-to-man. As it sounds, in man-to-man a defensive player is assigned to an offensive player and is tasked with staying close to that player. Simple, right? Not exactly. At times the coverage can get confusing and break down.
In the first clip, the VGK88 overskates his man on the shot and allows an uncontested rebound opportunity. That could also happen in zone coverage, though. What is perhaps more unique to man-to-man it the positioning of the wingers. Both are out high and are supposed to be defending the opposing defensemen at the points. Since VGK75 is looking at the puck, SJ61 can easily slip in and gets a rebound chance.
In the second clip, it should look quite unnatural when VGK73 goes to the point instead of supporting his defenseman. This allows the puck to cycle low. When VGK89 supports his defenseman, there is a forward unmarked in the slot who is able to recover the rebound and keep the play going.
Starting in November, the Golden Knights switched to a zone coverage. Man-to-man is a high-pressure coverage focusing on puck retrieval while zone coverage places more focus on keeping the play to the outside. Notice the layers of support and the positioning of the wingers.
In the first clip, it is clear that the center and defenseman are working together as a group. VGK26 is “shadowing” the defensemen by staying in between them and the net. They keep the play on the boards and work the puck out as a group.
The second clip shows the zones quite well. VAN43 carries the puck down the wall and the Golden Knights defenders switch with ease. When VAN43 sends a pass to the high slot, VGK21 is there to break up the potential scoring opportunity. The weakside winger probably wouldn’t have sagged in the high slot like that in a man-to-man scheme.
The change to zone coverage also puts them in a better position on breakouts. Think of the hockey positions as football positions for a second. Wingers are like wide receivers, centers are like tight ends, and defensemen are like running backs. You would prefer not to have your running backs going deep while your wide receivers are shallow, right?
The Tuch goal especially shows the benefits of this. Had he defended VAN43 down low in a man-to-man, it is unlikely he would’ve been in the position to score this goal.
At the moment, teams aren’t getting any offensive zone time thanks to their impeccable offensive and neutral zone forechecks. However, if they do face a team that can create some offensive zone time, we will be able to see if Peter DeBoer really took this Golden Knights team from good to great.
From the Spreadsheets
Meghan Hall
If you’ve been on Twitter during these playoffs (or if you read the first section of this newsletter), you’ve probably seen a reference or two to a “power kill.”
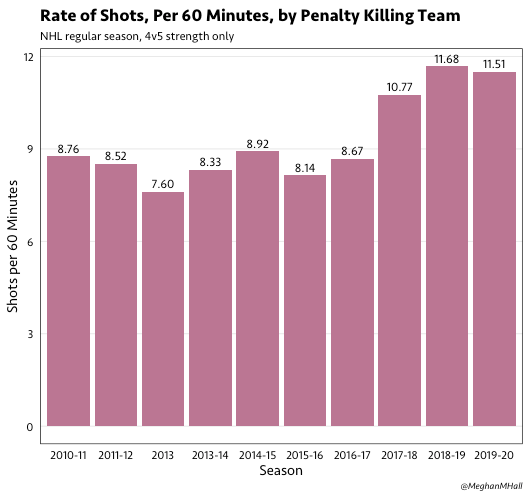
The power kill refers to a team’s penalty kill that plays aggressively with regard to their own offense, which has been a trend league-wide over the past several seasons. As you can see in the graph below, the shot rate for the penalty killing team has increased over the past few seasons, with a high of almost 12 shots on goal per 60 minutes last season.

And many of the teams that made the playoffs this season are teams that are known to have a particularly aggressive power kill: Philadelphia, Carolina, Columbus, Boston, and Tampa, just to name a few. During the 2019-20 regular season, Philadelphia led the league with their 26.6 percent penalty kill shot share—meaning that when Philadelphia played at 4v5, one out of every four shots on goal was taken by their penalty killing unit instead of by the power play team. League-wide, this penalty kill shot share has increased from 14 percent in 2015-16 to nearly 19 percent in 2018-19 and 18 percent this season.
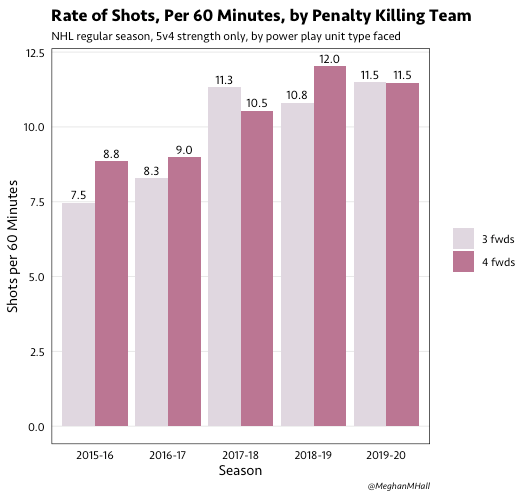
To explain this change, one seemingly-logical conclusion people jump to is the increasing prevalence of the four-forward power play: the share of all 5v4 time that involves four power play forwards, as opposed to three, has increased from 52 percent in the 2015-16 season to over 73 percent in this most recent season. However, if we look at the shot rate for the penalty killing team based on what type of power play they’re facing, the differences aren’t quite as stark as one might expect.

The shot share for the penalty killing team is lower when they are facing a four-forward power play than a three-forward one, likely because a power play with four forwards is generally able to generate more offense. However, manual neutral zone tracking data indicates that a penalty kill plays more aggressively in terms of zone entries when they’re facing a four-forward power play.
Regardless of the type of power play that the penalty kill is facing, there are benefits to adopting a more aggressive style of offensive play. Of course there’s the chance for a shorthanded goal, but more broadly, time spent in the neutral zone or in the penalty killing team’s zone means less time in the offensive zone for the power play time and fewer opportunities for them to generate offense. In a tracking project I did during the 2018-19 season, Philadelphia spent the highest percentage of time out of the power play’s zone while they were on the penalty kill, and that metric was, as expected, negatively correlated to the rate of unblocked shots that the power play was able to generate. In the games I tracked, Philadelphia did not get particularly strong results controlling play when they were in their defensive zone, but they spent enough time out of their defensive zone that their penalty kill was overall quite good.
So while you’re watching these playoff games, keep an eye out for an aggressive penalty kill—particularly for the Flyers—and the benefits it reaps. And to read more about the power kill, check out these links:
Play-by-play data via scraper, position data via Evolving-Hockey.com.
Where’s the Data?
The data necessary for the type of analysis I did above is available to anyone! The most granular data available to the public is the official NHL play-by-play data (also referred to as RTSS data, for the Real-Time Scoring System), for which there are scrapers available in both R and Python. Evolving Hockey also has a very useful PBP query tool that is available to their Patreon supporters. Summary data is available in many places, including Evolving Hockey, though some download functions are restricted to Patreon subscribers only. Natural Stat Trick has game data, summary data for teams and seasons, data on coaches, and biographical data for players (e.g., position, size, draft slot), which can be very useful for combining with play-by-play data. MoneyPuck also has summary data for teams and seasons, plus a very comprehensive data set on shots and their characteristics.
We hope you enjoyed the first edition of our newsletter! Subscribe if you haven’t already, share this post on Twitter if you liked it, and leave a comment below to let us know what other topics you’d like us to cover!


