Thanks to all of you who have signed up for our Hockey Graphs newsletter! If you’re new, this newsletter, created and written by a selection of Hockey Graphs contributors, aims to provide short-form, timely content that complements the research on our site. You can read more about our goals for this newsletter here, and as always, please reach out on Twitter and let us know what you’d like us to cover.
In this issue:
Alison Lukan and Shayna Goldman recap each round 2 series in Watch the Game.
Shawn Ferris looks into the adjustments that helped push Tampa’s powerplay over the edge in The Eye Test.
Meghan Hall investigates when teams have been pulling their goalies during these playoffs in From the Spreadsheets.
—The Hockey Graphs team
Watch the Game
Alison Lukan and Shayna Goldman
Round 2 of the playoffs was exciting not only because we finally got exactly three (3) Games 7, but also because there were some surprises along the way where sometimes what our eyes saw on the ice wasn’t exactly reflected on the scoreboard. In fact, some games were real head scratchers and arguably two non-favorites - the Islanders and the Stars - advanced.

So what happened?
Let’s dig in:
New York Islanders over Philadelphia Flyers
The Flyers were a favorite not just against the Islanders but to really go the distance in this postseason; they were one of the hottest teams at the NHL’s pause and earned the number one seed in the East when play returned.
And a quick glance below the surface could give the appearance that the Flyers were actually the better team through much of this series, particularly when they fell to a 3-1 series deficit - the Flyers had earned the advantage of the 5-on-5 score and venue adjusted shot share in three of those four games; ironically, the game the Islanders mustered 56 percent of the shots (and the Flyers didn’t have that advantage) was the one Philadelphia lost.
But here’s the twist. While Corsi is rightfully a foundational component of hockey analytics, it doesn’t always tell the full story, and that’s particularly true for the Islanders who are known for getting shot quality over quantity. Throughout these seven games, the Islanders took the majority of the shots in just three games, and only one of those games resulted in a win.
But that isn’t to say the Islanders haven’t been solid offensively. Since returning to play, the team earned one of the best expected goals for rates in the league despite not shooting as frequently.
So while the Flyers may have won the shot share battle, the key to this series was from where the Islanders allowed those shots. While New York managed to get to the quality areas, the Flyers, as Micah Blake McCurdy of HockeyViz described it, were left with scraps.
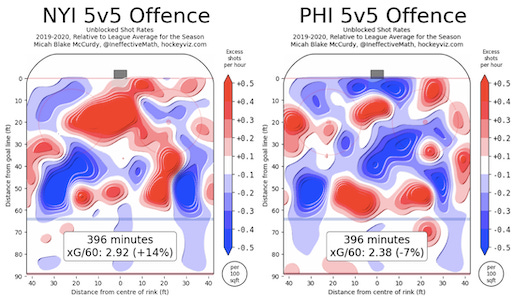
The pieces came together for the Islanders who had the proven the ability to limit quality chances against. It’s been their strength throughout this postseason; that, paired with their ability to consistently find scoring chances, has propelled them to the Eastern Conference Final.
Tampa Bay Lightning over Boston Bruins
The Bruins were one of the best teams defensively in the regular season; they were a top-five team in limiting their opponents shots and the best team at suppressing quality chances. In Round 1 against the Hurricanes, Boston continued to be one of the best at limiting scoring chances against. And then came the Lightning...
Tampa Bay has one of the best offenses in the league, but there was some concern about the team’s viability without star Steven Stamkos in the lineup for the series – especially when having to go up against a Bruins team that is so solid on both ends of the ice.
In their five-game series against the Lightning, the Bruins were expected to allow 2.53 goals against (as shown on the right chart below), which is a massive spike from their sterling 1.98 xGA/60 (shown on the left). And unfortunately, they didn’t have the offense to make up for their defensive woes, creating just 1.94 xGF/60.
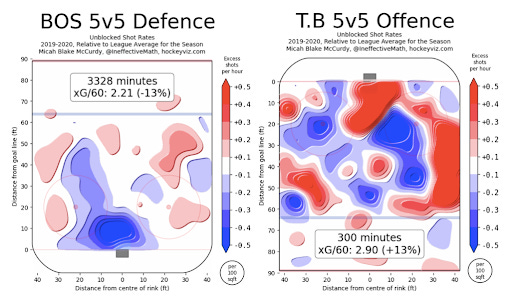
While Tampa Bay may not be known for their defensive prowess – rather, it’s their offense and goaltending that often highlight their play – they actually weren’t far behind Boston in the regular season. The Lightning allowed a lower rate of shots against at 5-on-5 before the season came to a pause, and slightly trailed their division rivals in expected goals.
In this series, the team defense of the Lightning kept Boston outside of the higher danger areas of the ice, while their Stamkos-less offense pushed right to the Bruins’ crease and it delivered them the series win and a chance to grab a conference title.
Vegas Golden Knights over Vancouver Canucks
The Golden Knights had built a 3-1 lead over Vancouver in Round 2, and it seemed likely that all the major prognosticators would prove right having picked Vegas to advance to the Conference Championship. But the reason this series went longer than “expected”? Thatcher Demko.
When you look at the rookie goaltender’s performance in the final four games of the series, it’s not just Mark Stone who should be in awe of what Demko did.
Demko jumped into the Canucks lineup for his first game action since March 10 and promptly rattled off what is currently one of the most impressive goaltending performances of the playoffs. Albeit a small sample size (4 GP), Demko was second only to Philadelphia’s Carter Hart in terms of outperforming the workload he faced.
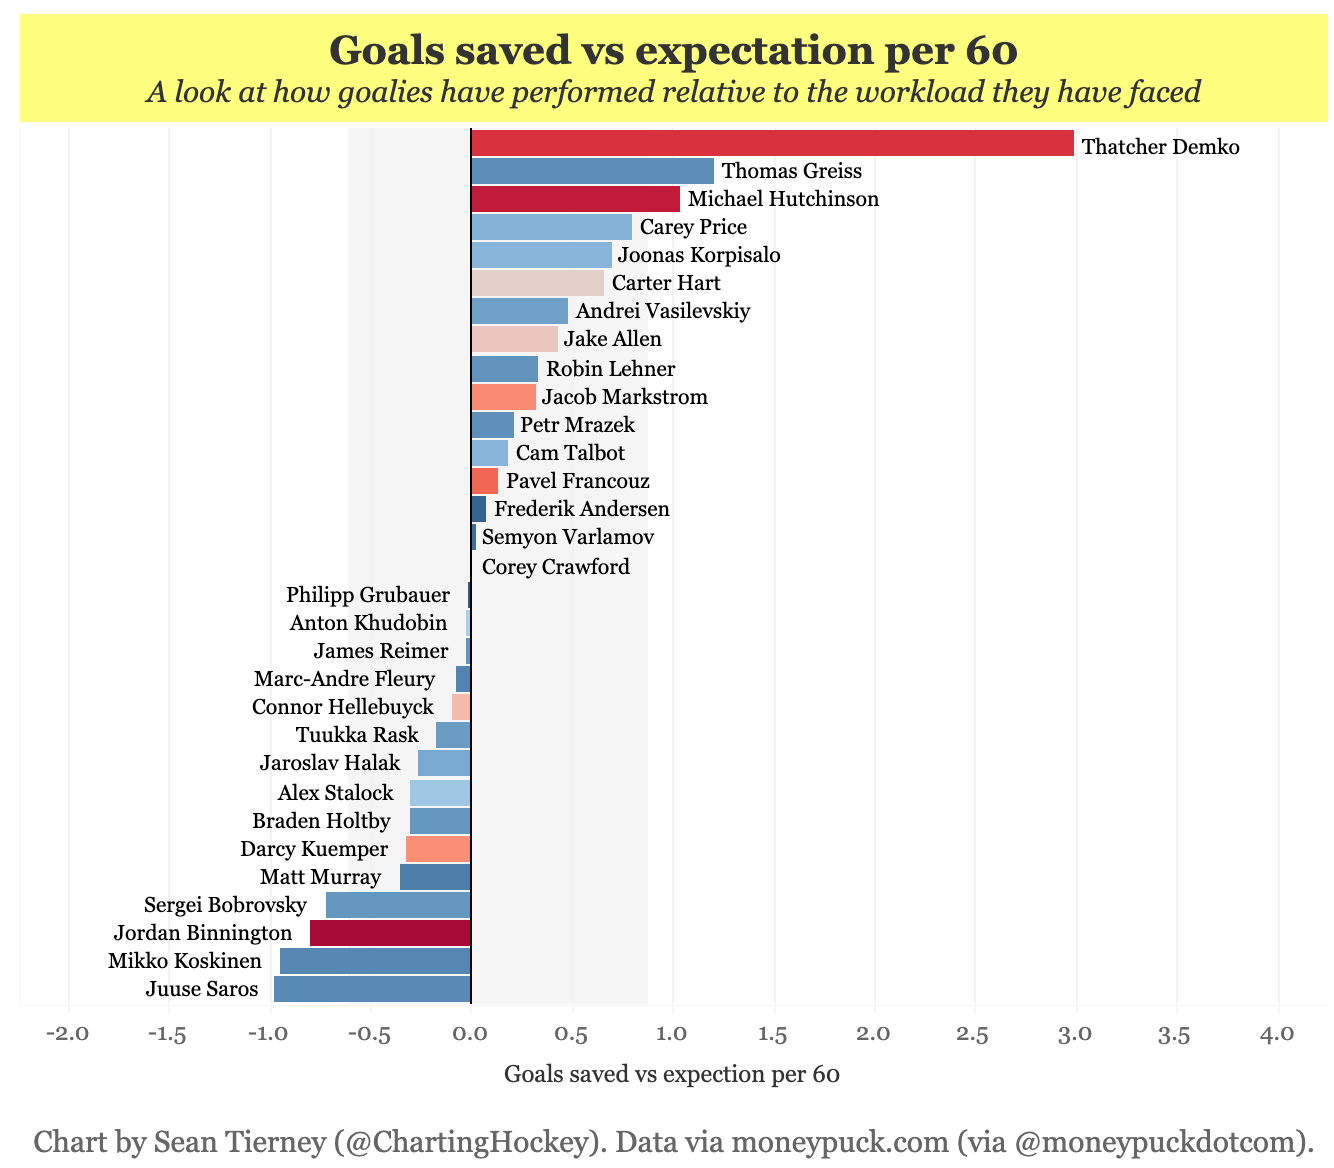
And that becomes even more impressive when you look at his individual game performance. According to Evolving-Hockey.com, no goaltender in the postseason faced a more difficult workload per 60 minutes of play (4.01 expected goals against) and excelled so significantly – Demko’s 3.41 goals saved above expectations (GSAx) per 60 was also tops in the league with the second best performance coming from the Islanders’ Thomas Greiss who had...1.06 GSAx. Just an incredible performance from the Canucks goaltender and one that arguably extended the series far longer than it would have otherwise gone.
Dallas Stars over Colorado Avalanche
The Avalanche came into the playoffs seeded second overall in the West and they looked legit...until the injuries hit. By now everyone knows the list of names of Colorado players who were “unfit to play” by the time Game 7 came along: Matt Calvert, Joonas Donskoi, Pavel Francouz, Philipp Grubauer, and Gabriel Landeskog, but how significant were those losses? Quite a bit.
With the forwards lost alone, Colorado was without 13.1% of its regular season (>250 TOI) goals above replacement (GAR).
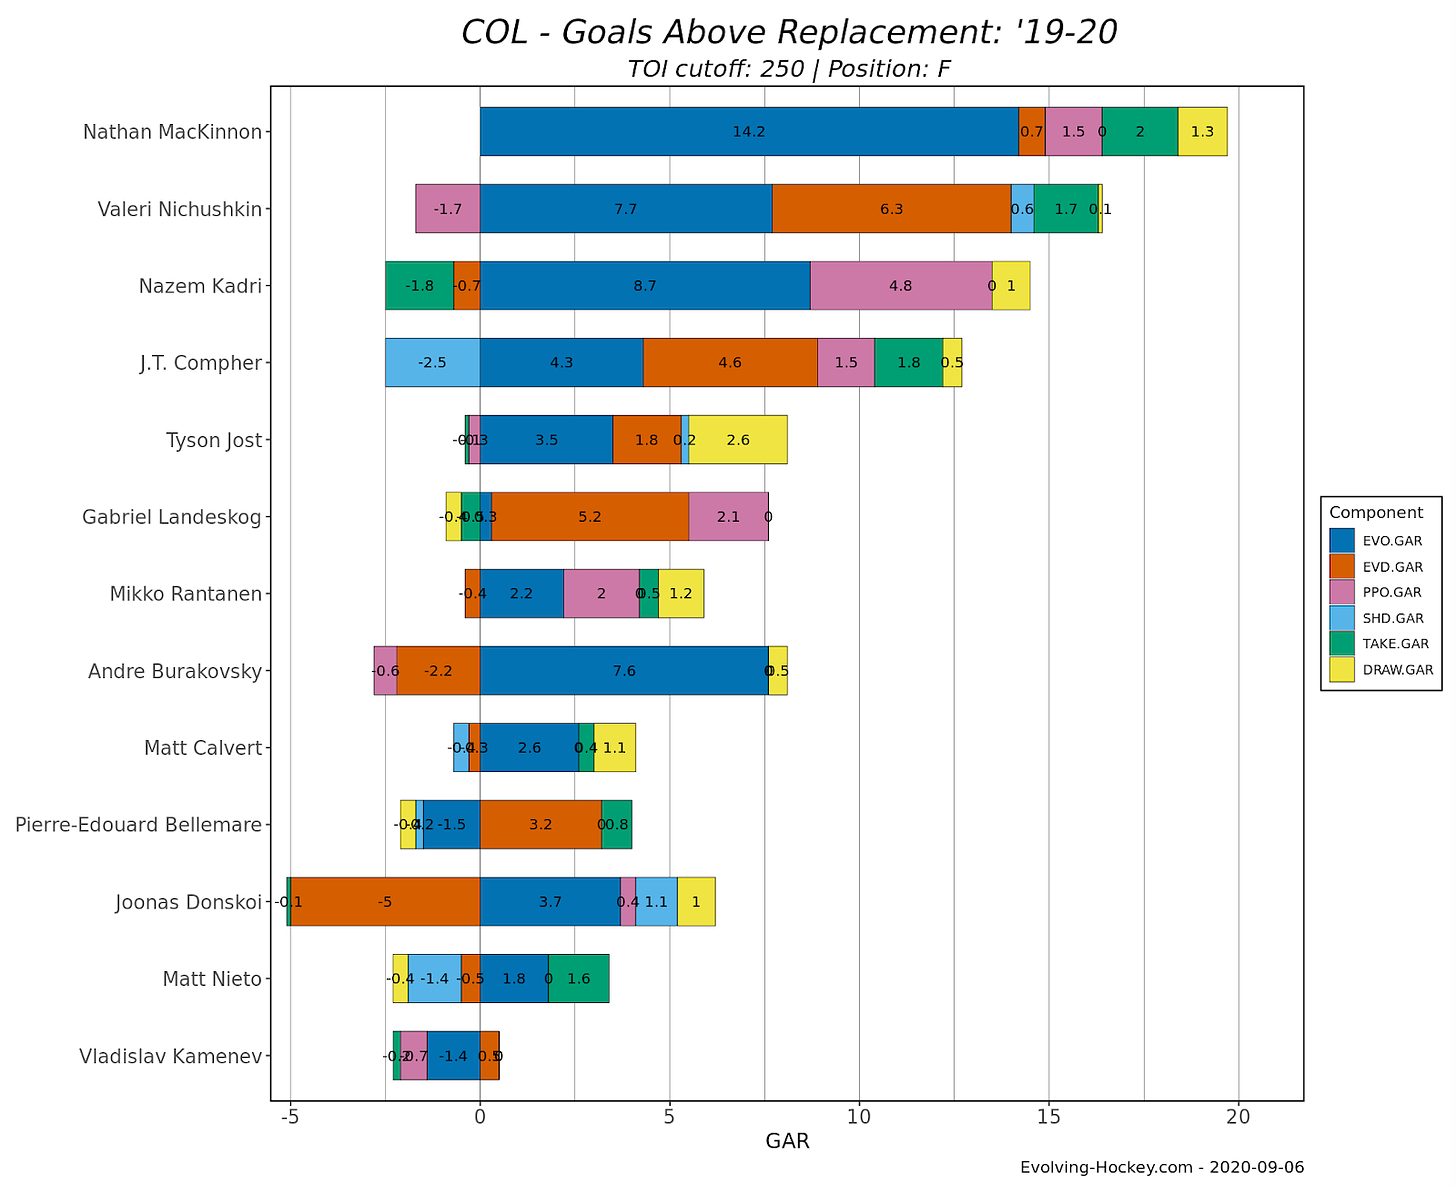
That kind of loss is significant, and certainly disrupts the capabilities of lines and overall offense, but what’s more interesting is looking at the elements of GAR lost. At even strength, Donskoi was top-six offensively (3.7), and only Valeri Nichushkin provided more of a defensive contribution (6.3) than Landeskog (5.2). That latter point is particularly concerning when you look at the other massive impact of injury: goaltending.
Grubauer and Francouz had split the net almost perfectly even in the regular season, and both ranked in the top 31 goaltenders who had faced 500 or more unblocked shots in terms of GSAx, but that was behind a top five defense (2.17 expected goals per 60). When you impact that with losses in the defensive play in front of net, Michael Hutchinson was facing 2.64 xGA per 60 in his time in the post-season. It’s impressive his GSAx per 60 stayed relatively at expectations at -0.143.
But overall, the sum of the injuries incurred by the Avalanche at specific impact points made their loss much more likely than had the team been healthy.
Data via Evolving-Hockey.com.
The Eye Test
Shawn Ferris
In the first Hockey Graphs newsletter, Alison Lukan and Shayna Goldman warned everyone that the Tampa Bay Lightning powerplay may be due to start scoring some goals. That very night, they did just that, scoring 3 goals with the man advantage. But what adjustments were made on the ice that helped push the Lightning over the hump?
To start the second game of the series, the Lightning were running with Kucherov on his off-wing in the 1-3-1, and Palat on his strong side. This should make sense. Kucherov is one of the best shooters in the NHL, and especially in the absence of Steven Stamkos, running the powerplay through Kucherov’s one-time abilities sounds like the best option. Unfortunately for the Lightning, the Bruins powerplay was able to adapt to the one-dimensional powerplay.
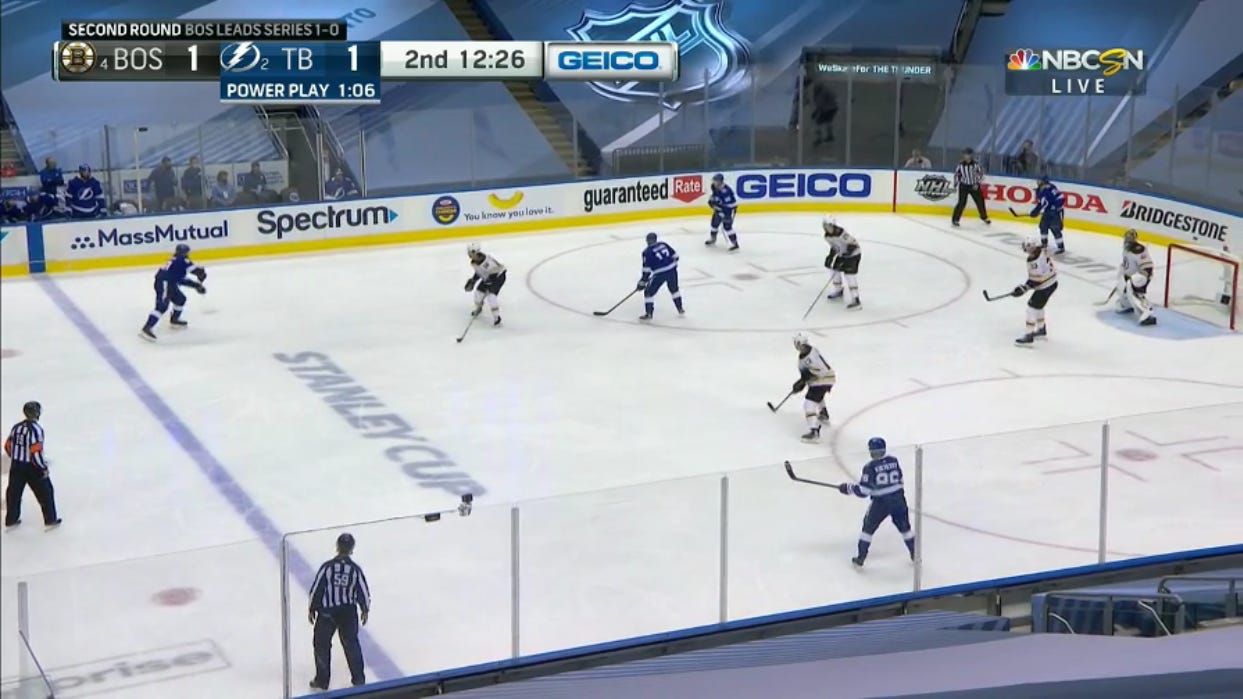
At the beginning of the third period, the Lightning swapped Kucherov and Palat, as well as Point and Killorn. This gave the Lightning more options and was eventually the setup that clicked.

Having at least one flank on their strong side is becoming quite popular as of late. There are trade-offs for flanks being on their strong side as opposed to their off-wing. While they lose the one-time threat, they have an easier time retrieving and protecting the puck. In order to balance these trade-offs, some teams are electing to use one strong-side flank and one off-wing flank.
The Lightning stuck with the same personnel, so why was switching the players’ positions so effective? Specifically, what did Nikita Kucherov do so well that allowed him to transition into a playmaker as opposed to a shooter?
The Sergachev goal was his only primary assist on the powerplay that evening. A few things stick out immediately. First off, he covers a lot of ground. He starts up by the blue line and ends down by the goal line. Secondly, he receives the puck on the move. Rather than squaring himself to the puck, he takes the puck on his backhand and begins moving down the ice while keeping his body open to the play. This helped freeze the penalty killers as he was threatening to move the puck but also helped him see the play develop. Once he turns himself to face the goal line, he begins to sell the penalty killers on the cross-ice pass, especially considering he becomes less of a shooting threat as he moves lower and lower. This helps collapse the defense and allows Sergachev to take a medium danger one-time opportunity.
On the goal to Killorn, Kucherov covers even more ground. He goes all of the way up into the neutral zone so that he can take his pass with speed. It is important to point out how deep he receives this puck. He gets the puck on his left hip and in the middle of crossing over to his left. This allows him to protect the puck from an aggressive penalty killer. He then uses his vision to see the cross-ice passing lane form and takes advantage of it before a Bruins penalty killer could close it.
To close, Kucherov’s mobility on his strong side, paired with his elite vision and ability to read plays, helped push the Lightning powerplay over the edge. Ironically, the Bruins had a similar fate when they switched a static Ryan Spooner for Brad Marchand a couple of years back. As Bruce Cassidy said after the game, the Bruins penalty kill did a poor job of controlling where the shots were coming from. The fluid powerplay put the Bruins powerplay into a state of reaction, which the Lightning were able to take full advantage of.
Note: The Lightning have changed back to their previous setup but will continue to have the option to switch players’ positions in their back pocket.
From the Spreadsheets
Meghan Hall
Pulling the goalie in hockey is the ultimate high-risk, high-reward move. You get an extra skater on the ice while trailing late in the game, but your own goal sits dangerously empty. The decision on when to pull the goalie depends on several factors—including but not limited to the score difference in the game and the coach’s proclivities—but one widely-referenced recommendation available at The Pull Bot suggests that, in order to maximize the possible standings points, the goalie should be pulled on average with 4:10 to go when down one goal and at 6:18 when down by two goals.
If those times sound outrageous to you, take comfort that they sound outrageous to most coaches, as well. During the 2019-20 regular season, the average pull time when down by one goal was only 1:46, and over the past several seasons, the only standard goalie pull ahead of the Pull Bot’s recommendation was done by Dallas in 2018, when they pulled at 7:48 when down by two goals.
But right now we’re in the playoffs, and what does pulling the goalie look like in the playoffs?
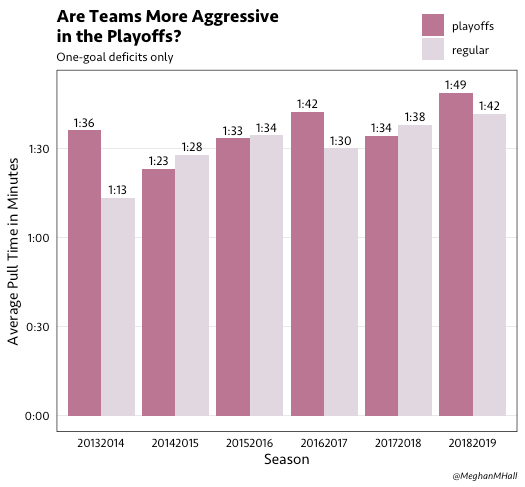
Looking at the graph above (originally published on Hockey-Graphs), we can see that there doesn’t appear to be a substantial, sustained difference when comparing playoff pull times to those in the regular season. (Although we do know that teams facing a deficit in playoff series tend to be slightly more aggressive than teams that are leading the series.) And so far in the 2020 playoffs, compared to an average 1:46 pull time in the regular season when down by one goal, teams are pulling at an average of 1:36. The success rate (the percentage of goalie pulls, when down by one goal, that resulted in a tie game) is slightly down, as well: 12.5% in these playoffs compared to 14.5% in the 2019-20 regular season.
However, there have been a handful of particularly aggressive and/or notable pulls during these playoffs. Dallas has been consistently aggressive, pulling at over three minutes and five minutes, respectively, when down by two and three goals. They also pulled at 2:11 while down 1 in Game 4 against Calgary and later won in overtime to tie their series. In Game 5 against Columbus, Tampa Bay pulled their goalie at 1:53 and ended up winning the game in overtime to move onto the second round. And perhaps most notably (at least to someone who spends a lot of time studying goalie pulling data), Toronto pulled the goalie down three with 4:18 to go in their Game 4 against Columbus and scored three goals, all at 6v5, to tie the game. In the data that I’ve looked at, starting with the 2013-14 season, it’s the first successful outcome when a team pulled their goalie down by three.
What about the general tendencies of the four teams left in these playoffs?
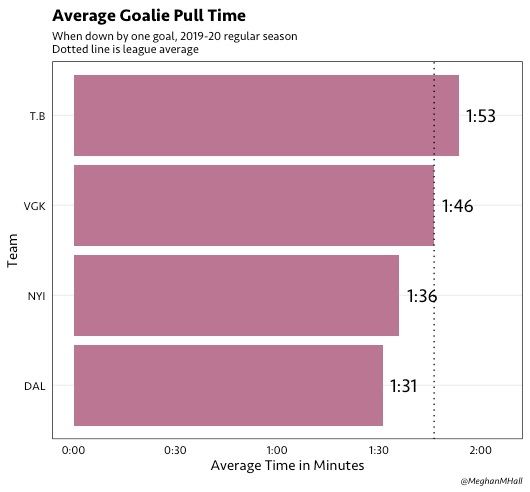
None of these teams were particularly aggressive in the regular season; Tampa is the only team above the league average when considering a one-goal score difference. The sample sizes for larger score differences are smaller, but Vegas and New York both showed at times that they were willing to pull aggressively (at 4:07 and 5:12, respectively, while down by three goals). Vegas also had one of the few successful two-goal comebacks this season against Montreal, after they pulled their goalie with only 2:06 to go.


Great accompanying visuals and sections are perfect length—I'm loving the flow of this newsletter! GJ